Categories
Economics

Economic Cooperation and Trade Agreement between India and Australia (AI-ECTA)

The Economic Cooperation and Trade Agreement (ECTA) between Australia and India has been approved by the Australian Parliament. This agreement has been viewed as a chance for expanding Indian businesses.

Background

  • Australia and India formally reopened CECA negotiations in September 2021 with the goal of reaching an Economic Cooperation and Trade Agreement (AI-ECTA).
  • It aspires to speedily liberalise and expand bilateral trade in products and services, using this as a base to pick up the more ambitious CECA negotiations.

India-Australia ECTA

  • It includes practically all of the tariff lines that Australia and India trade in.
  • Tariff Lines: This product falls under the definition of a tariff line item. A particular tariff is a tax that is tacked directly onto a single imported good and is unrelated to the value of that import. Typically, a certain tariff is determined by the volume or number of imported items.
  • Australia will grant India preferential market access on 100% of its tariff lines, while India will grant Australia preferential market access on more than 70% of its tariff lines.
  • Indian STEM (Science, Technology, Engineering, and Mathematics) graduates will be eligible for extended post-study work visas under the terms of the agreement.
  •  It will grant 96% of Indian exports to Australia duty-free access, as well as 85% of Australian exports to the Indian market.
  • Visas: Every year, 1,800 yoga instructors and Indian chefs are allowed to travel to Australia from India, and 1,000 work/vacation visas will be made available for young professionals. Over 100,000 Indian students will benefit from post-study work permits for up to four years.
  • Wine: India has agreed to lower tariffs on Australian wine over a ten-year period, although the existing 150% customs levy on wine bottles under $5 will remain in place.
  • Agriculture and dairy industries: By excluding the most delicate agricultural products from the FTA, India has completely shielded its dairy industry from any tariff reductions.

Significance

  • To start, from the current level of US$ 31 billion in bilateral commerce, it will surpass US$ 45–50 billion in 5 years. By 2026–2027, India’s merchandise exports are forecast to grow by $10 billion.
  • Secondly, because labor-intensive industries will gain, it is anticipated that this will lead to the addition of at least 10 lakh new jobs in India, as well as several prospects for investment and startup promotion.
  • Thirdly, it would give Indians in Australia better job possibilities and boost remittances to India.
  • Increased Exports: India now has a tariff disadvantage of 4% to 5% in numerous labor-intensive industries compared to rivals in the Australian market including China, Thailand, Vietnam, South Korea, Japan, Indonesia, and Malaysia.
  • The ECTA’s removal of these restrictions might greatly increase India’s exports of goods.
  • Cheaper Raw Materials: Raw materials and intermediate goods make up a larger portion of Australian exports to India. Many Indian companies will benefit from cheaper raw materials and increase their competitiveness as a result of having zero-duty access to 85% of Australian goods, especially in industries like steel, aluminium, electricity, engineering, and so forth.
  • Change in Perceptions of India: The new trade agreement will help to dispel misconceptions about India in the developed world, which have long stereotyped it as being “protectionist,” as well as concerns about its willingness to conduct business with other nations.

Effects on India

  • Strengthening of global supply chains: India’s goal in concluding a comprehensive economic partnership with these nations is to join the global value chains (GVCs), which are primarily based on trade and foreign direct investment.
  • Promote a global perspective: Investment protection is covered in several major mega-economic treaties, including the Comprehensive and Progressive Agreement for Trans-Pacific Partnership (CPTPP) and the Regional Comprehensive Economic Partnership (RCEP).
  • A more robust Indo-Pacific Strong Australia-India economic ties will also pave the way for a stronger Indo-Pacific economic architecture that is based on developing capacity-led connections, complementarities, sustainable commitments, and mutual dependence across nations and sub-regions rather than just on flows of physical goods, money, and people.
Categories
Economics

EAC-PM Paper Identifies ‘Serious Issues’ With 3 Global Indices’ Methodologies

In a recent working paper, the Economic Advisory Council to the Prime Minister examined three perception-based indices: the Freedom in the World Index, the V-DEM indices, and the EIU Democracy Index.

Key Highlights

  • India has been ranked at the same level as it was during the Emergency in the 1970s according to the Freedom in the World Index and V-DEM rankings.
  • India is currently ranked below nations like Northern Cyprus.
  • However, the technique employed in these perception-based indices has significant flaws, according to the report.
  • The World Bank ought to make sure that these organisations operate with more transparency and accountability because these indices serve as inputs for the World Governance Indicators.

Issues

  • The judgments of a small number of unidentified “experts” form the foundation of these indices.
  • The questions that are asked are subjective and written in such a way that it is impossible to provide an objective response, let alone one that allows for cross-national comparison.
  • Some inquiries that ought to be made but are not
  • Some of the questions included in these indices are not a reliable indicator of democracy in all nations.

Freedom in the World Index

  • Freedom House has been publishing it since 1973.
  • The classification for India is “partly free.”
  • India will receive a score of 66 in 2022.
  • On political rights, 33 out of 35; on civil liberties, 33 out of 42.
  • Democracy Index
  • The Economist Intelligence Unit is the publisher (EIU).
  • India is categorised as a “Flawed Democracy.”
  • India is in 46th place.
  • India saw an improvement in its ratings in the categories of political involvement, civil liberties, and government operation.

Varieties of Democracy (V-DEM) indices

  • The Varieties of Democracy Institute at the University of Gothenburg in Sweden created it, and it comes out with six indices that cover different facets of democracy: liberal democracy, Electoral democracy, liberal component, egalitarian component, participatory component, and deliberative component.
  • India’s position: 93rd
Categories
Economics

Project UNNATI: lags??

Project Unnati, which aims to lessen reliance on the Mahatma Gandhi National Rural Employment Guarantee Scheme (MGNREGS) by providing skill training to its beneficiaries, has received less than enthusiastic response. As a result, the Union Rural Development Ministry wants to tie the performance of the States under the project to their labour budget for the upcoming fiscal year.

Reasons

  • The project has only trained slightly more than 25,000 people since its launch in 2020, far shy of its 2 lakh aim. Prior to this extension, the project was supposed to be finished by March 2022.
  • The problem becomes more pressing because many households only rely on MGNREGA for survival. The beneficiaries designated by the states for skill and training, however, continue to be few in number.
  • The effort is made challenging by the State government’s disregard for the Unnati initiative.
  • In order to effectively use the MGNREGA programme (Unnati), the central ministry has instructed the states to pay at least 20% of the households that complete 100 days of service.
  • Therefore, the Ministry aims to tie Project UNNATI’s success to its labour spending plan. As a result, the States’ labour budgets will be determined by how well they do on the project.

Project UNNATI

  • Unnati was established with the goal of improving the skill set of MGNREGS employees to aid in their transition from part-time to full-time employment.
  • Objective: To provide training to one adult household member (18–45 years old) who has completed 100 days of service under the MGNREGS.
  • Funding: The Central Government is solely responsible for all costs associated with a stipend, as well as wage loss compensation.
  • Types of skill training: The Deen Dayal Upadhyay Grameen Kaushal Yojana (DDU-GKY), the Rural Self Training Institute (RSETI), and the Krishi Vigyan Kendra are three well-known training programmes that the chosen applicants are trained in.
  • Take note: The DDU-GKY is a placement-linked programme that mandates that at least 70% of trained individuals choose jobs paying at least Rs 6,000 per month.

Features:

  • The Mahatma Gandhi NREGA continues to provide 100 days of work to the household from which candidates are chosen for training.
  • The candidates undergoing training are paid a stipend for a maximum of 100 days and for one programme per household as per the wage rate currently in effect in the relevant State/UT as per the project’s provisions.
  • The full costs for a stipend, against wage loss compensation, are entirely covered by the Central Government.
  • Over the course of three years, this initiative will provide training to a total of 2,000 000 people across 26 States and 2 UTs.

Mahatma Gandhi National Rural Employment Guarantee Scheme (MGNREGA)

  • The Ministry of Rural Development started MGNREGA, one of the largest work guarantee programmes in the world, in 2005.
  • The scheme’s main goal is to guarantee 100 days of employment to adult members of any rural household who are willing to perform unskilled manual labour for the public good.
  • There are 15.4 crore active workers under the MGNREGA as of 2022–23.
Categories
Economics

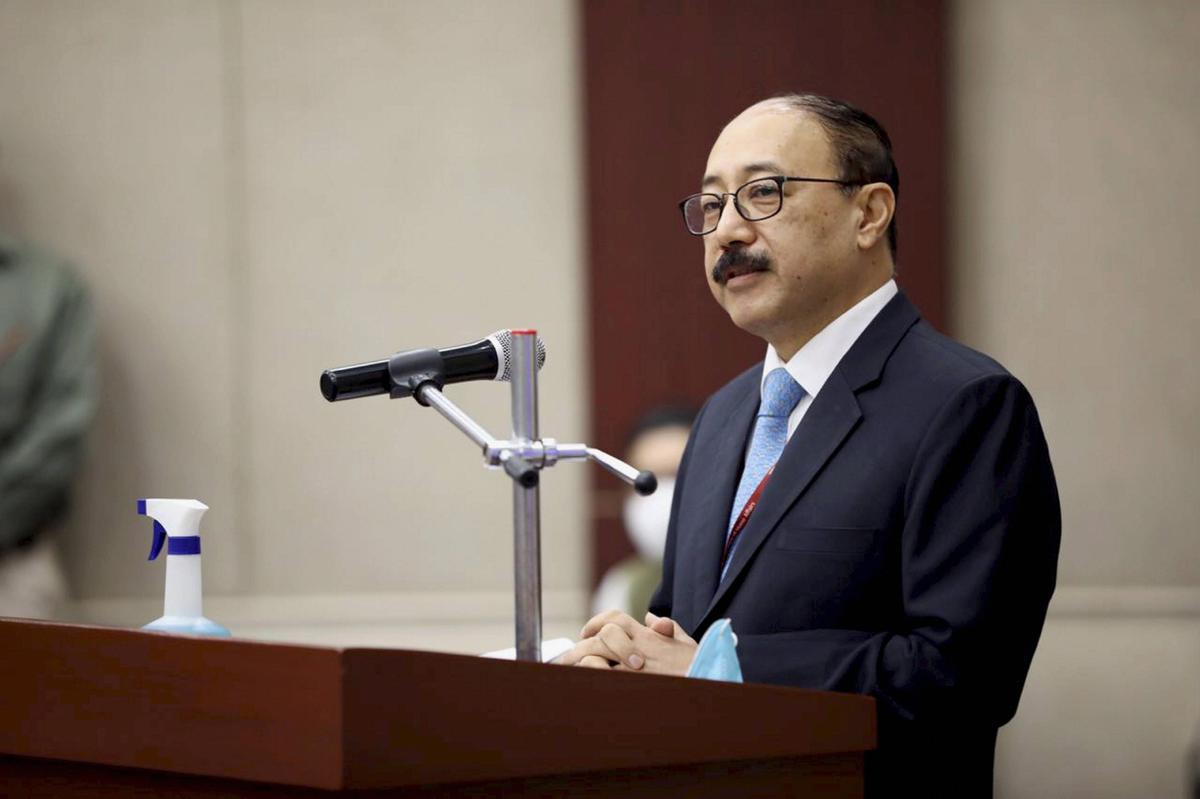
India’s soft loans to neighbours up to $15 billion: Shringla

  • India’s economic and diplomatic initiatives, which are based on universally acknowledged norms, include expanding and strengthening connectivity with its neighbour countries.
  • The volume of India’s soft loans to neighbouring countries has increased from about $3 billion to almost $15 billion in the last eight years. 

Soft Loans?

  • Soft loans, also referred to as ‘soft finance’ or ‘concessional funding’, feature mild terms such as:
  • Symbolic interest rate
  • Long tenure up to 50 years;
  • Interest holidays;
  • Extended grace periods where only interest or service costs are payable;
  • Soft loans are frequently given by global development institutions such as the Asian Development Fund affiliates of the World Bank, etc.

Why are they popular?

  • Diplomatic tool: Soft loans are frequently given not only to assist developing countries but also to establish political and economic ties with them.
  • Economic benefit: Countries trade credit for valuable resources.
  • Geopolitics: Soft loans have been a crucial diplomatic tool to uphold political influence in the immediate region and beyond as well as to confront the expanding Chinese presence, particularly in Africa.

Pros and cons

  • Advantageous business opportunities are provided by soft loans.
  • Disadvantage: Uncertain Returns—Because soft loans may take a long time to repay, the lender may be obligated to the borrower for a long period of time.

Soft loan taken by India

  • For instance, in 2015 Japan provided India with a soft loan to finance 80% of the $15 billion cost of a bullet train project at an interest rate of less than 1%. This was done under the condition that India would buy 30% of the project’s equipment from Japanese suppliers.
  • By the time the parties signed a formal agreement, Japan had upped its contribution to 85% of the project’s anticipated $19 billion cost in the form of soft loans.

Soft loans: a diplomatic tool

  • India provided more than twice as much development assistance to other countries in 2019–20 as it did in 2011–12.
  • Nevertheless, these loans have typically gone to less developed nations in Asia, Africa, and Latin America.
  • Since 2002–2003, India has provided lines of credit totaling $27.8 billion.

@the-end

  • India has a long history of providing development aid, and grants and loans to other governments, particularly those of India’s neighbours, account for roughly half of the budget of the foreign ministry.
  • India is aware of the diplomatic significance of lending a helping hand as a nation that for a long time relied on foreign financing to achieve important development goals.
Source—https://www.thehindu.com/news/national/indias-soft-loans-to-neighbours-up-to-15-billion-shringla/article66160648.ece
Categories
Economics

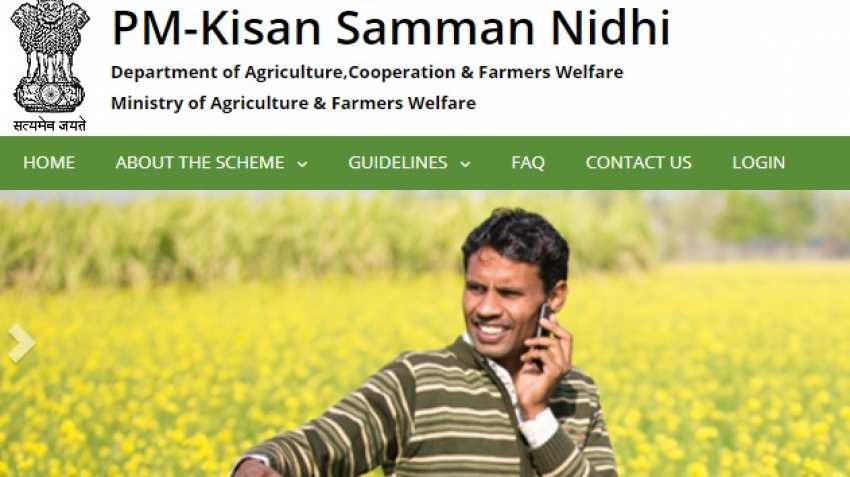
PM Kisan Scheme

In the past three years, the number of beneficiaries of the Pradhan Mantri Kisan Samman Nidhi (PM-KISAN) plan has decreased by 67% (from roughly 11.8 cr to about 3.8 cr).

Reasons

  • The States were still in charge of keeping the beneficiaries’ data.
  • The Scheme makes considerable use of digital technologies to confirm a farmer’s eligibility.
  • The data of farmers so uploaded by States goes through numerous validations, through the portals of UIDAI, PFMS, Income Tax Portal, and NPCI. The data of farmers so uploaded by States goes through several validations, through the portals of UIDAI, PFMS, Income Tax Portal, and NPCI.

PM-KISAN

  • All small and marginal farmers will receive up to Rs 6,000 per year as minimum income support under the PM-KISAN Yojana, a government programme. It is a Central Sector programme that receives full support from the GoI. It started operating on December 1st, 2018.
  • All landholding farmer households would receive a financial benefit of Rs. 6000 annually, payable in three equal instalments of Rs. 2000 each, every four months, under the PM-KISAN scheme.
  • According to the plan, a family consists of a husband, wife, and any minor children.
  • In accordance with the requirements of the scheme, the State Government and UT administration will identify the farming families that are qualified for support.
  • The beneficiaries’ bank accounts will receive a direct deposit of the money.
  • Note that using Aadhaar is no longer required to receive the first instalment (December 2018 – March 2019). However, it is now required.

Eligibility

Higher economic status beneficiaries in the following groups are not eligible for benefits under the programme.

Farmer families that belong to one or more of the following categories:

  • Former and current constitutional officeholders
  • Previous and current members of the Lok Sabha, Rajya Sabha, state legislatures, and state legislative councils; former and current mayors of municipal corporations; former and current district panchayat chairpersons.
  • All officers and workers of Central/State Government Ministries, whether currently employed or retired
  • All superannuated or retired pensioners receiving a monthly pension of at least Rs. 10,000. (Excluding Class IV/Group D personnel and Multi-Tasking Staff) of the aforementioned categories
  • People who paid income tax in the most recent assessment year, including everyone who did so; 
  • People who are registered with professional organisations like doctors, engineers, lawyers, Chartered Accountants, and architects.
Source—https://pmkisan.gov.in/
Categories
Economics

India’s Economic Growth Story and the Roadmap for the Future

India will have achieved 100 years of independence by 2047. By then, India will be working to become a developed economy, which will require obtaining a minimum per capita income of $13,000.

Economic growth: the British period

  • Poor economic situation: It is not frequently appreciated how poorly India’s economy developed throughout the first half of the 20th century when it was ruled by the British. India’s yearly growth rate throughout the five decades was only 0.89%, according to one estimate.
  • Income per capita increased by a negligible 0.06%, outpacing the population’s rise of 0.83%. It is not unexpected that policymakers’ top priority immediately following independence was growth.

After Independence

India’s early development strategy included these four components:

  • Increasing the rate of savings and investment;
  • Prevalence of state intervention;
  • Import substitution; and
  • Domestic capital goods production
  • Growth that was low up until 1970: India’s average growth rate up until the end of the 1970s was 3.6%. With a 2.2% increase in population, the per capita income growth rate was incredibly low at 1.4%.
  • Social indicators have improved, including life expectancy and the literacy rate, which are both important health and social indicators.
  • The green revolution’s success After the Green Revolution, there was an advancement in agriculture, however initially India had to rely heavily on the concessional imports of food grains.
  • Industrial base widened: Over time, the industrial base grew. India developed the ability to manufacture a wide range of products, including steel and machinery.
  • Unsustainable fiscal policy: Despite numerous plans, actual growth lagged behind expectations. In the 1980s, the Indian economy did expand by 5.6%. However, a rapid worsening of the fiscal and current account deficits also occurred at the same time, and the economy experienced its greatest crisis in 1991–1992.

Statistics of Economic Expansion following-1991

  • Rapid economic expansion: From 1992–1993 to 2000–2001, GDP at factor cost increased by 6.20% yearly. It expanded by 7.4% between 2001-02 and 2012-13, and by 6.7% between 2013-14 and 2019-20.
  • Period of sustained high growth: The highest performance was between 2005–2006 and 2010–2011, when GDP expanded by 8.8%, clearly demonstrating what India’s potential growth rate was. This rise represents India’s highest over a sustained period of five to six years. This was true despite the fact that the 2008–2009 global financial crisis fell during this time frame.
  • Rising investment rate: The savings rate rose in lockstep with the rise in investment. With an average of 1.9%, the current account deficit in the Balance of Payments (BOP) remained small.
  • Growth story suffers setback after 2011–12: After 2011–12, the growth story experienced a setback. According to the 2004-05 series, the growth rate decreased to 4.5% in 2012-2013. Since then, there have been ups and downs in the growth rate. In 2019–20, the growth rate reached a 3.7% level.

Future Growth

  • Maintaining a continuous growth rate is the first and most important responsibility. According to calculations, India’s economy would significantly change if it could sustain a 7% growth rate for at least the next two decades. India’s economy may be on the verge of becoming developed.
  • Maintaining the incremental capital output ratio: India may easily reach a 7% growth rate if it keeps the incremental capital output ratio at 4, which reflects how effectively we utilise capital.
  • It is necessary to raise investment: Increasing investment depends on a variety of variables. It’s important to establish and maintain a favourable investment climate.
  • Public investment should increase, but private investment—both corporate and non-corporate—should account for the majority of investment. On this, a sound financial and fiscal system depends. It is impossible to overstate the significance of price stability in this situation.
  • India must accept the new technologies that have already appeared and those that will in the future. Its growth plan must be multifaceted.
  • India needs a robust export sector. It also needs a robust manufacturing sector. It is a performance evaluation. India also needs a robust manufacturing industry. This sector’s organised portion must expand as well.
  • Enhanced social safety nets: India must enhance its social safety net system as output and income rise. Equity is necessary for sustainable growth.

@the-end

India must continue to grow in order to accommodate its people. To boost economic growth, the government has implemented significant structural reforms and policy initiatives including GATI-SHAKTI. These are positive advances, and more of these liberalising initiatives ought to be supported.

Categories
Economics

Online Bond Platform under the SEBI framework

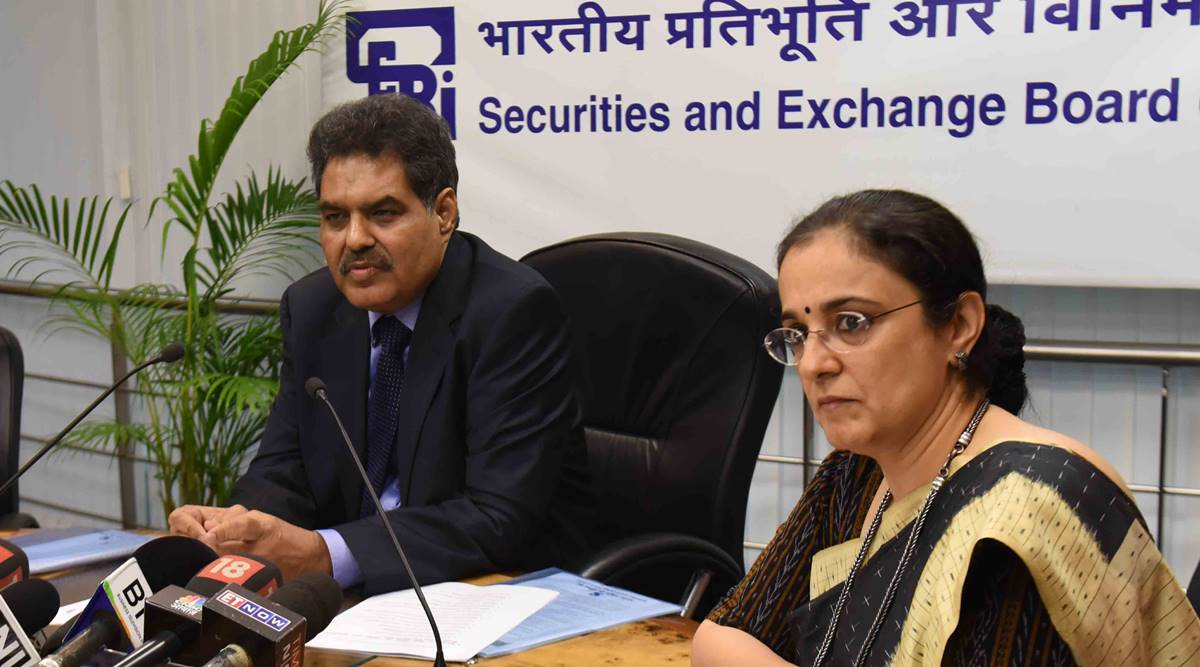
In an effort to streamline their operations, the Securities and Exchange Board of India (SEBI) recently released a comprehensive regulatory framework for online bond platform providers.

Online Bond Platform

According to SEBI, an online bond platform is any electronic system other than a recognised stock exchange or an electronic book that offers a platform on which debt securities are offered and transacted that are listed or intended to be listed.

Reasons for a regulatory framework for Online Bond Platform Providers (OBPPs)

  • Over the recent years, there have been more OBPPs that issue debt securities to non-institutional investors. The majority of them are stock broker-backed or fintech startups.
  • OBP operations, however, fell outside of SEBI’s regulatory purview. Consequently, this regulatory framework was created.

Regulatory framework for OBPPs: Provisions

  • Online Bond Platform Providers (OBPPs) are businesses with Indian corporate structures that need to register as stockbrokers on the debt market of the stock exchange.
  • The only goods or services that OBPPs may sell on its platform are listed debt securities and debt securities that are being considered for listing through a public offering.
  • In addition, the OBPPs would be responsible for ensuring that the minimal disclosure standards were met. Additionally, it would be required to disclose on its platform any and all potential conflicts of interest resulting from its dealings or transactions with connected parties.
Source—https://www.sebi.gov.in/legal/circulars/nov-2022/registration-and-regulatory-framework-for-online-bond-platform-providers_65014.html
Categories
Economics

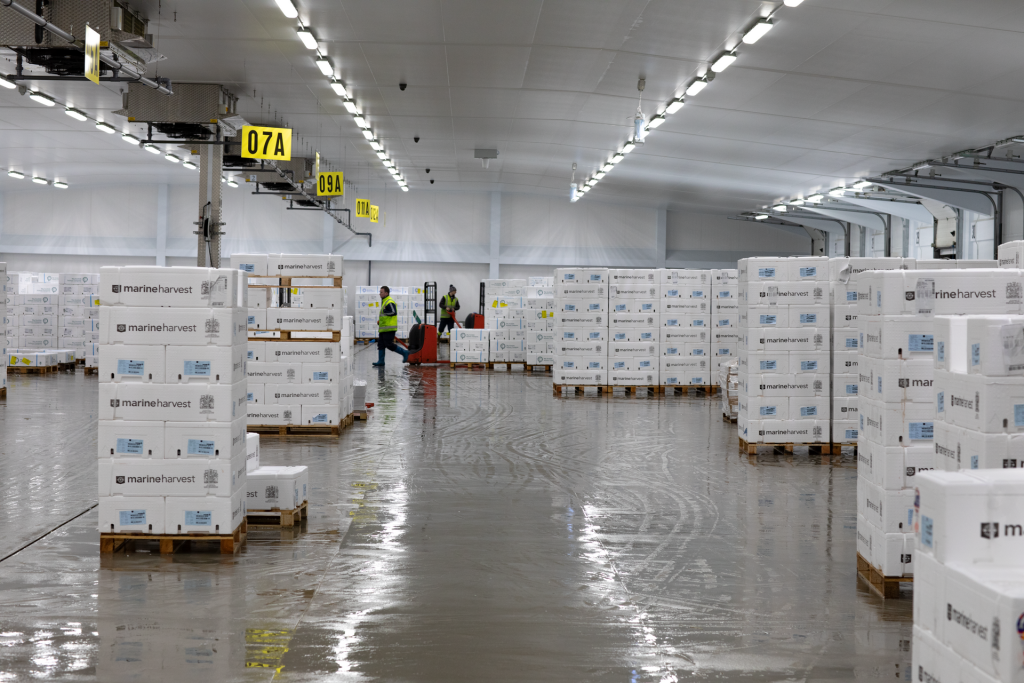
Reduce waste, Combat Climate change with Sustainable Food cold chain: UNEP & FAO report

Sustainable Food Cold Chains: Opportunities, Challenges and the Way Forward’ was a report that was recently released at COP 27.

Key highlights

  • For millions of people to escape the cycle of hunger and poverty, cold chains in the food processing, packaging, distribution, and consumption systems are essential. These systems will also help address the problem of feeding an extra two billion people by 2050.
  • It was suggested that governments and other cold chain stakeholders work together to produce National Cooling Action Plans using a systems approach.
  • 526 million tonnes of food output were directly lost due to ineffective refrigeration (12 per cent of the global total).
  • Food waste and loss contributed 8–10% of the world’s greenhouse gas emissions (GHG).
  • The poor world has a higher rate of food loss than industrialised nations since there is less refrigeration capability there.
  • Although developing nations account for approximately 80% of the world’s harvested cropland, just around 20% of the perishable food they produce gets refrigerated (compared with 60 per cent in developed countries).

The blue or cool revolution is what Indian agriculture needs to create a sustainable cold chain linking farms to cities and enable small farmers to create entrepreneurial agribusinesses that serve the expanding urban middle class.

Kigali Amendment

  • It offers a special chance to speed up the deployment of sustainable food cold chains.
  • These are on the Montreal Protocol’s contribution to the development of sustainable cold chains for reducing food waste.

Food insecurity

  • In 2021, there were 828 million hungry people in the world, an increase of 46 million over the previous year.
  • As a result of the economic effects of the Covid epidemic and rising inflation, over 3.1 billion people in 2020—an increase of 112 million from 2019—could not afford to eat a balanced diet.
  • It is estimated that 17% and 14%, respectively, of the entire amount of food produced for human use is wasted.
  • The global economy suffers a $936 billion annual loss as a result.
  • Worldwide, fewer than half (45%) of the food that needed to be refrigerated in 2017 was actually done so.
  • If developing nations had the same degree of infrastructure for the food cold chain as rich nations, they could save 144 million tonnes of food each year.

Impact on climate

  • In 2017, estimated emissions from food waste and loss owing to improper refrigeration totalled 1 gigatons of carbon dioxide (CO2) equivalent, or roughly 2% of all worldwide greenhouse gas emissions.
  • When emissions from cold chain technology and food loss brought on by inadequate refrigeration are considered, the food cold chain is responsible for about 4% of all global greenhouse gas emissions.

Cold chain Project

  • A cold chain initiative was created in 2016–17 and carried out with assistance from Carrier Transicold under the auspices of India’s National Centre for Coldchain Development (NCCD).
  • Precooling and aggregation techniques were used in the project to offer kinnow fruit, a hybrid mandarin that helped cut losses by 76% while also reducing emissions.

Green CHILL’s refrigeration Technique

  • It is a refrigeration unit that is driven by biomass and serves as an illustration of an alternative refrigeration method.
  • It generates cooling from biomass using an adsorption refrigeration method that employs water and R-717 (ammonia) as a refrigerant and has no potential to cause global warming.

Solar chilling

  • A Kenyan business created a solar chilling-in-transit system with a dairy management system powered by artificial intelligence to reduce spoiling in the milk supply chain.
  • In order to minimise loss and spoilage and to ensure that farmers can profit from the milk they produce, the system employs solar energy to keep the milk cool during transport from the farm to the collection centre.
  • Cooperatives and milk processors can also employ the technique.
Source—https://news.un.org/en/story/2022/11/1130532
Categories
Economics

Russian bank’s Vostro accounts in India

Vostro Accounts are opened in India by Russian banks Nine Russian banks have been given permission to open unique Vostro accounts, which will facilitate export-import business.

  • Sberbank and VTB Bank, the two biggest banks in Russia, are the first foreign lenders to gain RBI authorisation for rupee settlement of international trade transactions.
  • A Vostro account is simply a Nostro account with a different name. Customers can deposit money into this account operated by a bank on behalf of another bank.

Vostro account

  • A Vostro account is one that a domestic bank maintains in the domestic bank’s currency, in this example the rupee in the case of India, for a foreign bank. Payments in rupees for products imported and exported from Russia will be made to these Vostro accounts.
  • The exporters and importers in both countries will be the owners and recipients of this money. Banks will maintain a record of all money transfers.

Nostro account

  • The only distinction between Vostro and Nostro accounts is who opens the account and where it is opened.
  • As a result, if an Indian bank, such as SBI, wants to open an account in the US, it will contact a bank in the US, which will open a Nostro account and receive payments from SBI in dollars.
  • The account that the Indian bank opens in the US will be a Nostro account for the Indian bank, but a Vostro account for the US bank.
Categories
Economics

Old pension Scheme (OPS) Vs New Pension Scheme(NPS)

The announcements made by some political parties to transition to the Old Pension Scheme (OPS) in the run-up to elections are seen by experts as terrible economics and bad politics.

Several complaints and worries about the economic instability in the States have been raised as a result of the choice of certain state governments (Rajasthan, Chhattisgarh, and Punjab) to switch back to the Old Pension Scheme (OPS) rather than implement the New Pension scheme.

Background

  • The origins of the Indian pension system may be traced to British India’s colonial era.
  • The first-time government employees received pension benefits was in 1881, by the Royal Commission on Civil Establishments.
  • The pension is viewed as a liability for the government, which it must meet using its funds, and is funded by the governments of the centres and the states, as well as by the salaries of their employees. However, over the past three decades, the Center’s and the States’ pension liabilities have increased.
  • The Centre’s pension expenditure for 1990–1991 was Rs. 3, 272 crores, and the total expenditure for all states was Rs. 3, 131 crores.
  • The State’s bill increased 125 times to Rs. 3, 86,001 crores by 2020–21, while the Center’s bill increased 58 times to Rs. 1, 90,886 crores.
  • As a result, both the Center and the States are now required to use a sustainable means of financing pensions for employees.

Pension system in India

  • Benefits for maturity are guaranteed for all pension plans in India. This explains why pension plans are frequently referred to as guaranteed pension plans in India.
  • Typically, the fund value or 101% of the premium paid, whichever is higher, constitutes the maturity benefits.

Old pension Scheme (OPS)

  • The OPS is a guaranteed monthly family pension that is inflation-indexed as long as you (and your spouse) survive (s).
  • The last pay pensioner drew is what determines the OPS level.

New Pension Scheme

  • The NPS is a retirement savings programme designed to ensure a person’s financial well-being after retirement.
  • Its value is based on market prices where the corpus is invested.

The Concerns associated with the Old Pension Scheme

  • There was no dedicated pension fund that would continuously grow and be available for payments, so the pension liability remained unpaid.
  • No reliable source of funding: While pensions were included in the annual budget of the Indian government, it was unclear how they would be paid in the future.
  • The financial strain on the government: As at this point, all pensioners had been paid for by current taxpayers, who annually anticipated payments to retirees ahead of the budget.
  • The “pay-as-you-go” system produced concerns with intergenerational equity, forcing the current generation to shoulder the ever increasing burden of pensioners.

Negative Impacts of the Old Pension Scheme

  • Major financial distribution: State pension payments account for around a quarter of all state tax receipts. It is significantly higher in some states.
  • For Himachal, it is almost 80%; for Punjab, it is almost 35%; for Chhattisgarh, it is 24%; and for Rajasthan, it is 30% (pension as a proportion of state tax receipts).
  • Governmental budget deficits that are high States are left with very little from their tax revenues once this bill includes the wages and salaries of state government personnel.
  • Long-term Burden on Taxpayers: Current taxpayers are paying for retirees’ ever-rising pensions, and Pay Commission awards have nearly brought old retirees’ pensions up to current levels.
  • As a result, the pension for someone who retired in 1995 and someone who retires in 2025 may be equal.
JOIN OUR NEWSLETTER
And get notified everytime we publish a new blog post.